R §Œ ggplot2 §»§§§¶§Œ§¨Œ…§§§È§∑§§§» 𧧧ø§Œ§«ªÓ§∑§∆§þ§Î°£(•«°º•ø§œ Wikipedia §´§È)
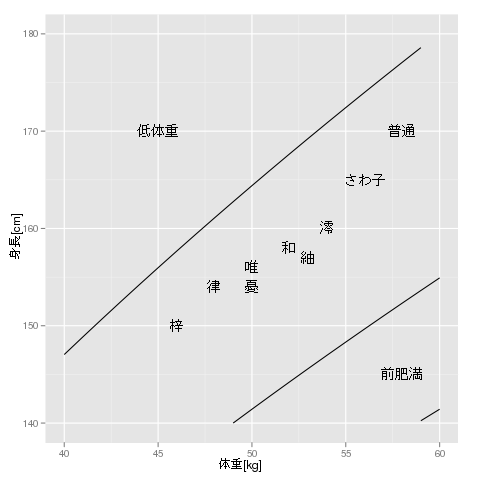
bmi-gnu_r-ggplot.R:
library(ggplot2)
names <- c("Õ£", "þ∫", "Œß", "ƒð", "∞¥", "§µ§Ôª“", "œ¬", "Õ´")
heights <- c(156, 160, 154, 157, 150, 165, 158, 154)
weights <- c(50, 54, 48, 53, 46, 56, 52, 50)
data <- data.frame(name=names, height=heights, weight=weights)
bmi <- function(b) function(w) sqrt(w/b)*100
x = seq(40,60,1)
p <- ggplot() + xlim(40,60) + ylim(140,180)
p <- p + geom_text(aes(x=data$weight, y=data$height, label=data$name))
p <- p + xlab("¬ŒΩ≈[kg]") + ylab("ø»ƒπ[cm]")
p <- p + geom_line(aes(x=x, y=bmi(18.5)(x)))
p <- p + geom_line(aes(x=x, y=bmi(25)(x)))
p <- p + geom_line(aes(x=x, y=bmi(30)(x)))
p <- p + geom_line(aes(x=x, y=bmi(40)(x)))
p <- p + geom_text(aes(x=45,y=170,label="ƒ„¬ŒΩ≈"))
p <- p + geom_text(aes(x=58,y=170,label="…·ƒÃ"))
p <- p + geom_text(aes(x=58,y=145,label="¡∞»ÓÀ˛"))
print(p)
§þ§ §µ§Û…·ƒÃ§«∑ÚπØ≈™§«§π§ °£
§Ω§Ï§œ§Ω§Ï§»§∑§∆°¢∂ ¿˛§Ú√º§Þ§«…¡§Ø ˝À°§¨§Ô§´§È§ §§°£
coord_cartesian() §Úª»§®§–§§§§§Œ§´°£
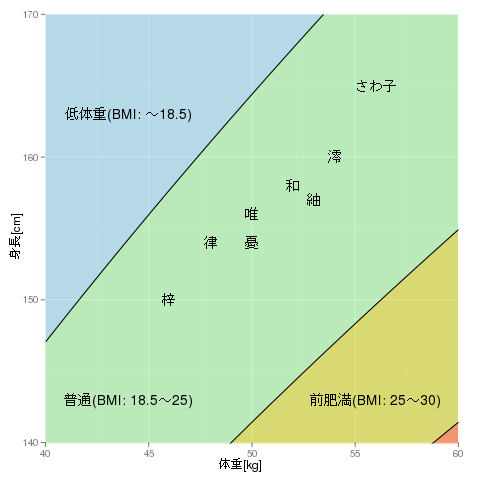
bmi-gnu_r-ggplot-2.R:
library(ggplot2)
names <- c("Õ£", "þ∫", "Œß", "ƒð", "∞¥", "§µ§Ôª“", "œ¬", "Õ´")
heights <- c(156, 160, 154, 157, 150, 165, 158, 154)
weights <- c(50, 54, 48, 53, 46, 56, 52, 50)
data <- data.frame(name=names, height=heights, weight=weights)
bmi <- function(b) function(w) sqrt(w/b)*100
xx = seq(40,60,1)
p <- ggplot()
p <- p + coord_cartesian(xlim=c(40,60), ylim=c(140,170))
p <- p + scale_y_continuous(breaks=seq(140,180,by=10))
p <- p + geom_ribbon(aes(x=xx, ymin=bmi(18.5)(xx), ymax=180), fill="skyblue", alpha=0.5)
p <- p + geom_ribbon(aes(x=xx, ymin=bmi(25)(xx), ymax=bmi(18.5)(xx)), fill="lightgreen", alpha=0.5)
p <- p + geom_ribbon(aes(x=xx, ymin=bmi(30)(xx), ymax=bmi(25)(xx)), fill="yellow3", alpha=0.5)
p <- p + geom_ribbon(aes(x=xx, ymin=130, ymax=bmi(30)(xx)), fill="orangered", alpha=0.5)
p <- p + geom_text(aes(x=data$weight, y=data$height, label=data$name))
p <- p + xlab("¬ŒΩ≈[kg]") + ylab("ø»ƒπ[cm]")
p <- p + geom_line(aes(x=xx, y=bmi(18.5)(xx)))
p <- p + geom_line(aes(x=xx, y=bmi(25)(xx)))
p <- p + geom_line(aes(x=xx, y=bmi(30)(xx)))
p <- p + geom_line(aes(x=xx, y=bmi(40)(xx)))
p <- p + geom_text(aes(x=44,y=163,label="ƒ„¬ŒΩ≈(BMI: °¡18.5)"))
p <- p + geom_text(aes(x=44,y=143,label="…·ƒÃ(BMI: 18.5°¡25)"))
p <- p + geom_text(aes(x=56,y=143,label="¡∞»ÓÀ˛(BMI: 25°¡30)"))
print(p)