天泣記

2012-03-01 (Thu)

#1

ふと、commit log のサイズを visualize してみる。

% tb svn-log http://svn.ruby-lang.org/repos/ruby/trunk -o ruby.csv
% tb newfield msgsize '_["msg"].length if _["msg"]' ruby.csv |
  tb cut date,msgsize,rev,author -o ruby-msgsize.csv

ruby-msgsize.png

ruby-msgsize.R:

library(ggplot2)
d <- read.csv("2012-03/ruby-msgsize.csv")
t <- table(d$author)
d$author <- reorder(d$author, t[d$author])
print(qplot(author, msgsize, data=d, geom="boxplot", group=author) + scale_y_log10() + coord_flip())

なにかわかるというわけでもないか。

2012-03-02 (Fri)

#1

こっちのほうがいくらかおもしろいか。

横軸は log scale な commit message のサイズ。単位は byte。

縦軸は commit message のサイズが (binwidth によって決まる) 特定の範囲のコミットの数。

log scale のときの binwidth はどういう意味なのだろうか、という話はあるが。

ruby-msgsize2.png

ruby-msgsize2.R:

library(ggplot2)
d <- read.csv("2012-03/ruby-msgsize.csv")
t <- table(d$author)
d$author <- reorder(d$author, -t[d$author])
print(qplot(msgsize, data=d, binwidth=0.1) + scale_x_log10() + facet_wrap(~ author, scale="free_y"))

自分のが、山がふたつあることがわかる。

#2

ggplot2 でエラーが出た。ggplot2 が古いという可能性を考慮し、install.packages("ggplot2") として、近く (つくば) のミラーを選んで、再度インストールするが、新しいものはないようである。

再現コードを最小化すると、以下のようになった。

> d <- data.frame(k=c("a","b"), v=c(0, 1))
> qplot(v, data=d, binwidth=I(1)) + scale_x_log10() + facet_wrap(~ k)
Error in if (any(diff(intervals) < -1e-06)) { :
  missing value where TRUE/FALSE needed

まぁバグだろうということで、報告するやりかたを調べていると、ML が基本のようである。ML に入って、ちょっと眺めると新しいリリースが出ているらしい。

えー調べたのに、と思って再度 install.packages("ggplot2") として、ミラーとして今度は CA(カリフォルニア)を選ぶと、新しいのが入って、ちゃんと動くようになった。ぬぅ。

ちなみに、問題が出たバージョンは ggplot2 0.8.9 で、新しいのは ggplot2 0.9.0 であった。

... まだ出ていなかったようだ。ちょうど今日リリースで、後からリリースが流れてきた。

2012-03-03 (Sat)

#1

じつをいえば、commit message のサイズよりも、まず commit 自体のサイズを visualize しようと思ったのだ。(誰が小さな/大きな commit をする傾向にあるだろう?)

commit のサイズというのは、はっきりしない点もあるが、追加/削除行数としよう。なお、バイナリファイルの変更は無視することにする。

しかし、svn log ではこの情報は出てこない。

git log なら出てくるので、こっちから取り出そう。

% git clone git://github.com/ruby/ruby.git
% tb git-log ruby -o ruby-git.csv
% tb cut commit,committer-name,committer-date,files ruby-git.csv -o r1.csv
% tb unnest files r1.csv -o r2.csv
% tb group commit,committer-name,committer-date -a 'sum(add),add' -a 'sum(del),del' r2.csv -o ruby-commitsize.csv

ruby-commitsize.png

ruby-commitsize.R:

library(ggplot2)
library(scales)
library(reshape)
d <- read.csv("2012-03/ruby-commitsize.csv")
d$committer <- reorder(d$committer.name, -table(d$committer.name)[d$committer.name])
d2 <- melt(d, c("commit", "committer"), c("add", "del"))
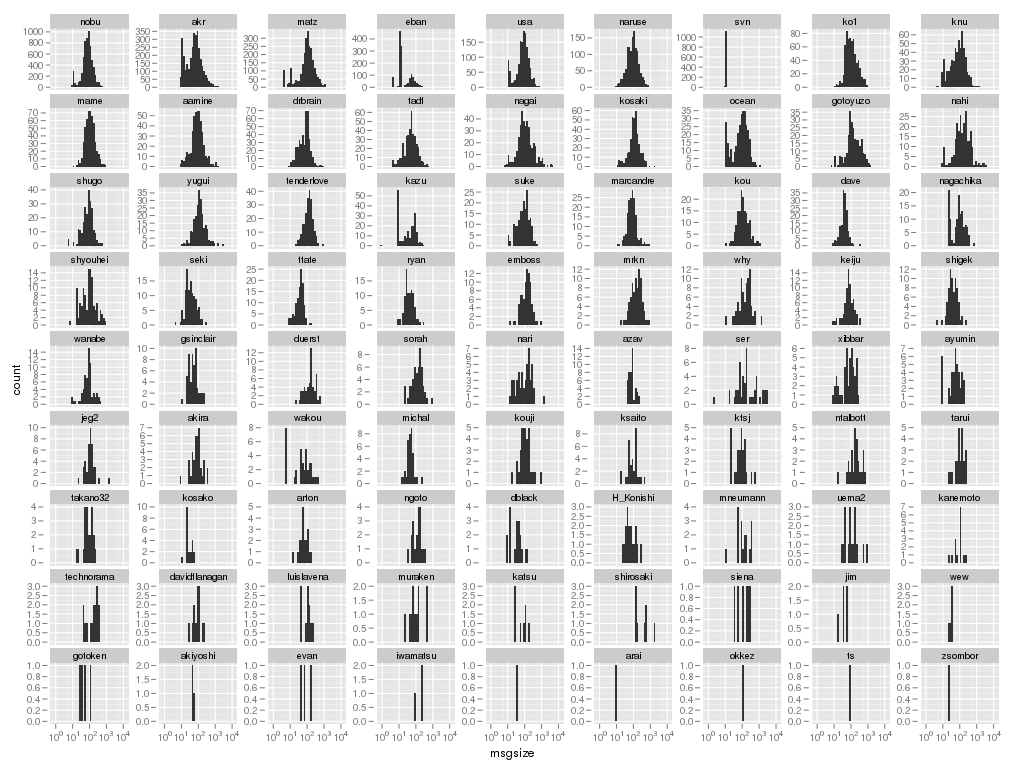
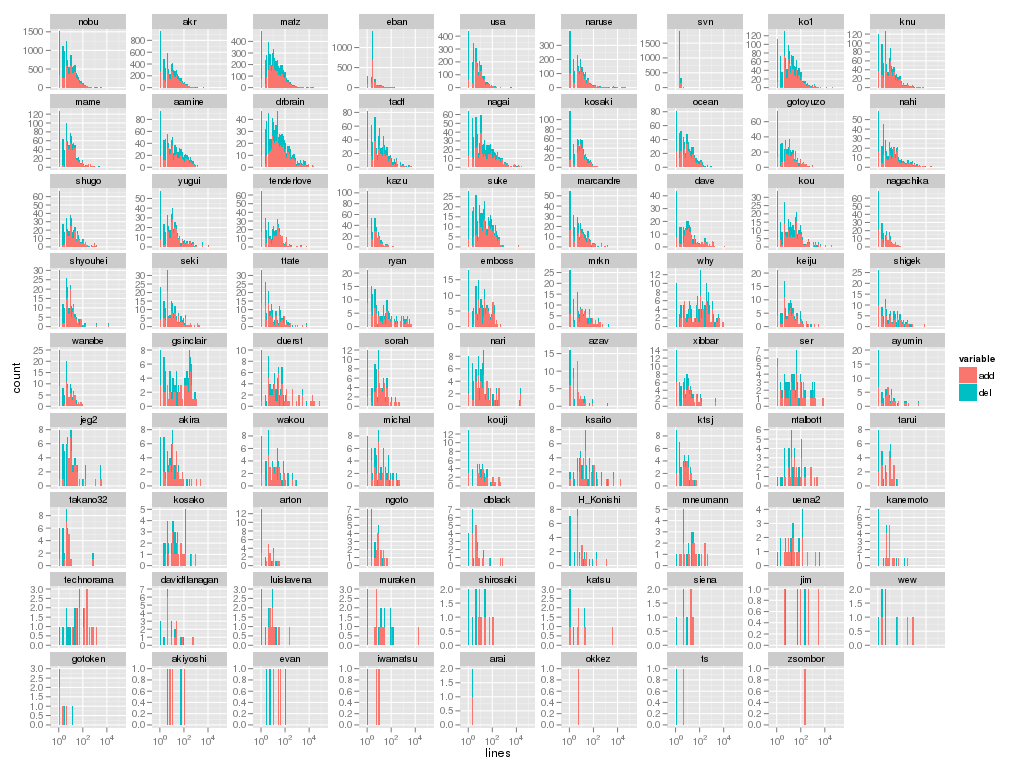
q <- qplot(value, data=d2, binwidth=I(0.1), fill=variable)
q <- q + facet_wrap(~ committer, scale="free_y")
q <- q + scale_x_log10(breaks = trans_breaks('log10', function(x) 10^x, n=4), labels = trans_format('log10', math_format(10^.x)))
q <- q + xlab("lines")
print(q)

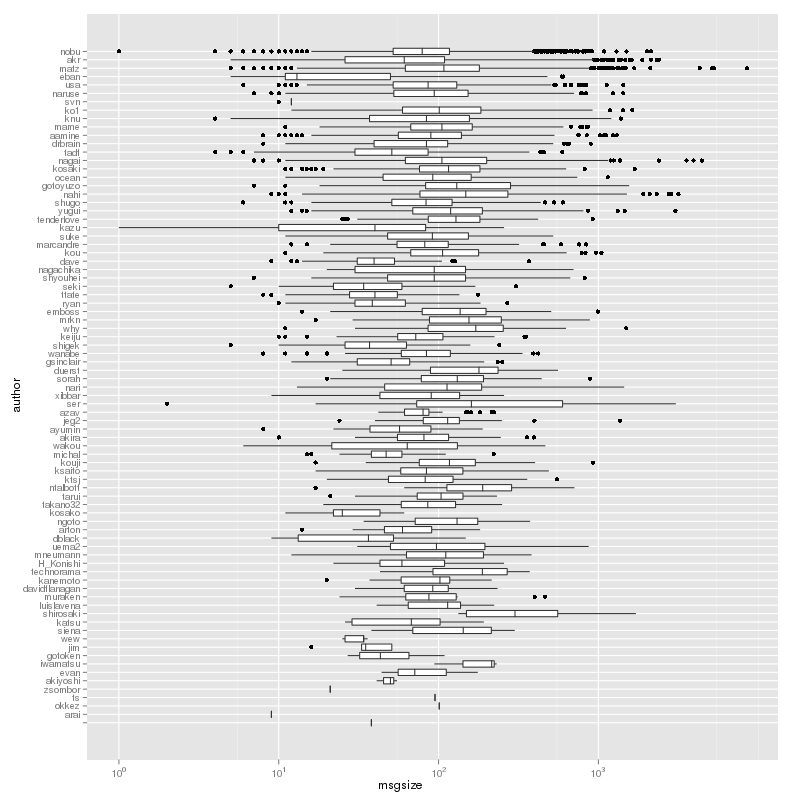
横軸は log scale な commit のサイズ。単位は行数。

縦軸は commit のサイズが (binwidth によって決まる) 特定の範囲のコミットの数。

大きな commit をする印象がある人は分布が右に広がっているような気がする。

削除ばかりする人がいたらおもしろいかと思って各 commit の add と del を別扱いしたが、いないようなので、足し算して当該 commit のサイズとしたほうがよかったかもしれない。

それはそれとして、ggplot2 0.9.0 の scale_x_log10 は表示形式が変わっていて、以前のようにするのに手間取った。

#2

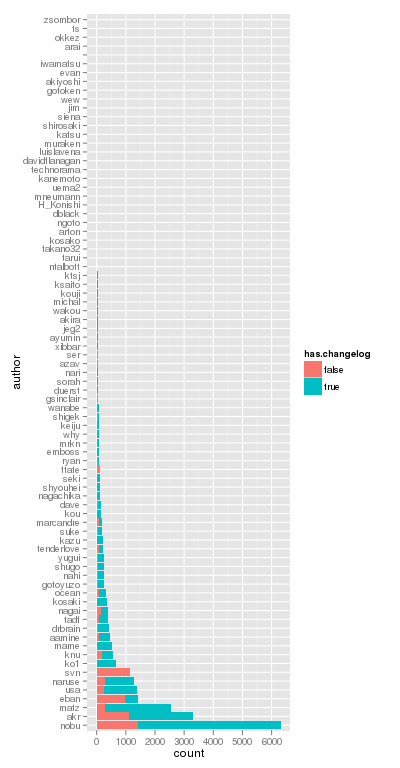
svn log で出てくる line ってなにかと思ったら、commit message の行数なのだな。

% svn log|grep line
r34874 | nahi | 2012-03-02 17:50:13 +0900 (Fri, 02 Mar 2012) | 4 lines
r34873 | nahi | 2012-03-02 17:16:14 +0900 (Fri, 02 Mar 2012) | 4 lines
r34872 | nobu | 2012-03-02 16:37:58 +0900 (Fri, 02 Mar 2012) | 2 lines
r34871 | nobu | 2012-03-02 16:37:13 +0900 (Fri, 02 Mar 2012) | 2 lines
r34870 | nobu | 2012-03-02 16:36:34 +0900 (Fri, 02 Mar 2012) | 3 lines
r34869 | svn | 2012-03-02 16:36:06 +0900 (Fri, 02 Mar 2012) | 1 line
r34868 | nobu | 2012-03-02 16:36:00 +0900 (Fri, 02 Mar 2012) | 2 lines
r34864 | nobu | 2012-03-01 16:13:22 +0900 (Thu, 01 Mar 2012) | 2 lines
r34863 | nobu | 2012-03-01 15:44:37 +0900 (Thu, 01 Mar 2012) | 3 lines
r34862 | nobu | 2012-03-01 15:40:09 +0900 (Thu, 01 Mar 2012) | 5 lines
...

svn log の結果を parse するためにあるらしい。(だから --xml オプションをつけると出てこないのだろう)

たしかに cvs log ではその点に問題があった覚えがあるが、なんというか解決の仕方が美しくない気がする。

tb svn-log では --xml を使っているので今まで気がつかなかった。

なお、git log の場合は --pretty=format:... の %w でインデントできて、tb git-log ではそれを使っている。

#3

なんか、git から生成した方がひとつグラフが少ない。

コミッタの名前がないグラフが足りないので、これは r1 だろう。svn log では (no author) とでてくるやつである。

% svn log -r1:2 
------------------------------------------------------------------------
r1 | (no author) | 1998-01-16 21:13:05 +0900 (Fri, 16 Jan 1998) | 1 line

New repository initialized by cvs2svn.
------------------------------------------------------------------------
r2 | matz | 1998-01-16 21:13:05 +0900 (Fri, 16 Jan 1998) | 2 lines

Initial revision

------------------------------------------------------------------------

ちょっと調べてみると git-log の引数に . をつけるかどうかの違いであった。

git-log では出てくる。

% git-log|tail -16
commit 3db12e8b236ac8f88db8eb4690d10e4a3b8dbcd4
Author: matz <matz@b2dd03c8-39d4-4d8f-98ff-823fe69b080e>
Date:   Fri Jan 16 12:13:05 1998 +0000

    Initial revision


    git-svn-id: svn+ssh://ci.ruby-lang.org/ruby/trunk@2 b2dd03c8-39d4-4d8f-98ff-823fe69b080e

commit 392296c12de9d7f9be03a8205250ba0844cb9d38
Author: (no author) <(no author)@b2dd03c8-39d4-4d8f-98ff-823fe69b080e>
Date:   Fri Jan 16 12:13:05 1998 +0000

    New repository initialized by cvs2svn.

    git-svn-id: svn+ssh://ci.ruby-lang.org/ruby/trunk@1 b2dd03c8-39d4-4d8f-98ff-823fe69b080e

しかし、git-log . では出てこない。

% git-log .|tail  
    git-svn-id: svn+ssh://ci.ruby-lang.org/ruby/trunk@8 b2dd03c8-39d4-4d8f-98ff-823fe69b080e

commit 3db12e8b236ac8f88db8eb4690d10e4a3b8dbcd4
Author: matz <matz@b2dd03c8-39d4-4d8f-98ff-823fe69b080e>
Date:   Fri Jan 16 12:13:05 1998 +0000

    Initial revision


    git-svn-id: svn+ssh://ci.ruby-lang.org/ruby/trunk@2 b2dd03c8-39d4-4d8f-98ff-823fe69b080e

tb git-log で . をつけているのが理由であった。

2012-03-04 (Sun)

#1

commit size と commit message size の相関を visualize してみよう。

tb git-log ruby -o ruby-git.csv &&
tb cut commit,committer-name,committer-date,raw-body,files ruby-git.csv -o r1.csv &&
tb newfield msgsize '_["raw-body"].length' r1.csv -o r2.csv &&
tb unnest files r2.csv -o r3.csv &&
tb group commit,committer-name,committer-date,msgsize -a 'sum(add),add' -a 'sum(del),del' r3.csv -o r4.csv &&
tb newfield commitsize '_["add"].to_i + _["del"].to_i' r4.csv -o ruby-msgsize-and-commitsize.csv

ruby-msgsize-commitsize.R:

library(ggplot2)
d <- read.csv("2012-03/ruby-msgsize-and-commitsize.csv")
t <- table(d$committer.name)
d$committer <- reorder(d$committer.name, -t[d$committer.name])
d <- d[d$commitsize != 0,]
p <- qplot(commitsize, msgsize, data=d, size=I(1), geom=c("point","smooth"), meth=lm)
p <- p + facet_wrap(~ committer)
p <- p + scale_x_log10()
p <- p + scale_y_log10(limits=c(10, 10000), breaks=c(10,100,1000,10000))
print(p)

ruby-msgsize-commitsize.png

横軸は変更行数 (追加行数+削除行数)。縦軸は commit message のバイト数。

なお、commit message は git から取り出したものなので、

git-svn-id: svn+ssh://ci.ruby-lang.org/ruby/trunk@34876 b2dd03c8-39d4-4d8f-98ff-823fe69b080e

というようなものが入っている。最低がだいたい100バイトなのはそのせいである。

大きい commit に小さい commit message が書かれることは珍しくない。しかし、小さい commit に大きい commit message が書かれることはまずない。

多くのひとについて、大きい commit では、平均的には大きな commit message が書かれる傾向が見て取れる。ただし、そういう傾向が薄いひともいる。

2012-03-05 (Mon)

#1

commit で ChangeLog の変更が入っているのはどのくらいの割合だろうか。

tb svn-log -o ruby-v.csv -- -v http://svn.ruby-lang.org/repos/ruby/trunk
tb newfield has-changelog '_["path"] == "/trunk/ChangeLog"' ruby-v.csv -o r1.csv
tb group rev,author -a 'uniquevalues(has-changelog)' r1.csv -o r2.csv
tb newfield has-changelog '!!(/true/ =~ _["uniquevalues(has-changelog)"])' r2.csv -o ruby-has-changelog.csv

ruby-has-changelog-ratio.R:

library(ggplot2)
d <- read.csv("2012-03/ruby-has-changelog.csv")
t <- table(d$author)
d$author <- reorder(d$author, -t[d$author])
print(qplot(author, data=d, fill=has.changelog, position="fill") + coord_flip())

ruby-has-changelog-ratio.png

横軸は ChangeLog を含まない commit の比率。

まぁ、いろいろか。個人的にはそれなりに多いはずで、そうなっている。

なお、横軸を比率じゃなくてコミット数にするとこんな感じ。

ruby-has-changelog-numcommit.R:

library(ggplot2)
d <- read.csv("2012-03/ruby-has-changelog.csv")
t <- table(d$author)
d$author <- reorder(d$author, -t[d$author])
print(qplot(author, data=d, fill=has.changelog) + coord_flip())

ruby-has-changelog-numcommit.png

2012-03-09 (Fri)

#1

各コミッタについて、最初のコミットから最後のコミットまでの期間を visualize してみた。

tb group author -a 'min(date),first' -a 'max(date),last' ruby.csv -o ruby-committer-duration.csv

ruby-committer-duration.R:

library(ggplot2)
library(reshape)
d <- read.csv("2012-03/ruby-committer-duration.csv")
d2 <- melt(d, "author")
d2$date <- as.POSIXct(strptime(d2$value, "%Y-%m-%dT%H:%M:%OSZ"))
t <- as.POSIXct(strptime(d$first, "%Y-%m-%dT%H:%M:%OSZ")) - Sys.time()
names(t) <- d$author
d2$author <- reorder(d2$author, -t[as.character(d2$author)])
d$firstdate <- as.POSIXct(strptime(d$first, "%Y-%m-%dT%H:%M:%OSZ"))
d$lastdate <- as.POSIXct(strptime(d$last, "%Y-%m-%dT%H:%M:%OSZ"))
p <- ggplot()
p <- p + geom_line(aes(date, author), d2)
p <- p + geom_point(aes(firstdate, author), d)
p <- p + geom_point(aes(lastdate, author), d)
print(p)

ruby-committer-duration.png

2012-03-28 (Wed)

#1

cvs.m17n.org を 4月いっぱいで閉じることになったので、必要な人はリポジトリのバックアップなどしてください。(バックアップのやりかたは cvs.m17n.org のトップページに書いてあります)

2012-03-29 (Thu)

#1

tb-0.5 をリリースした。


[latest]


田中哲